


With the free VSA Indicator for MetaTrader, trading becomes flexible and profitable!


VSA Histogram Signals
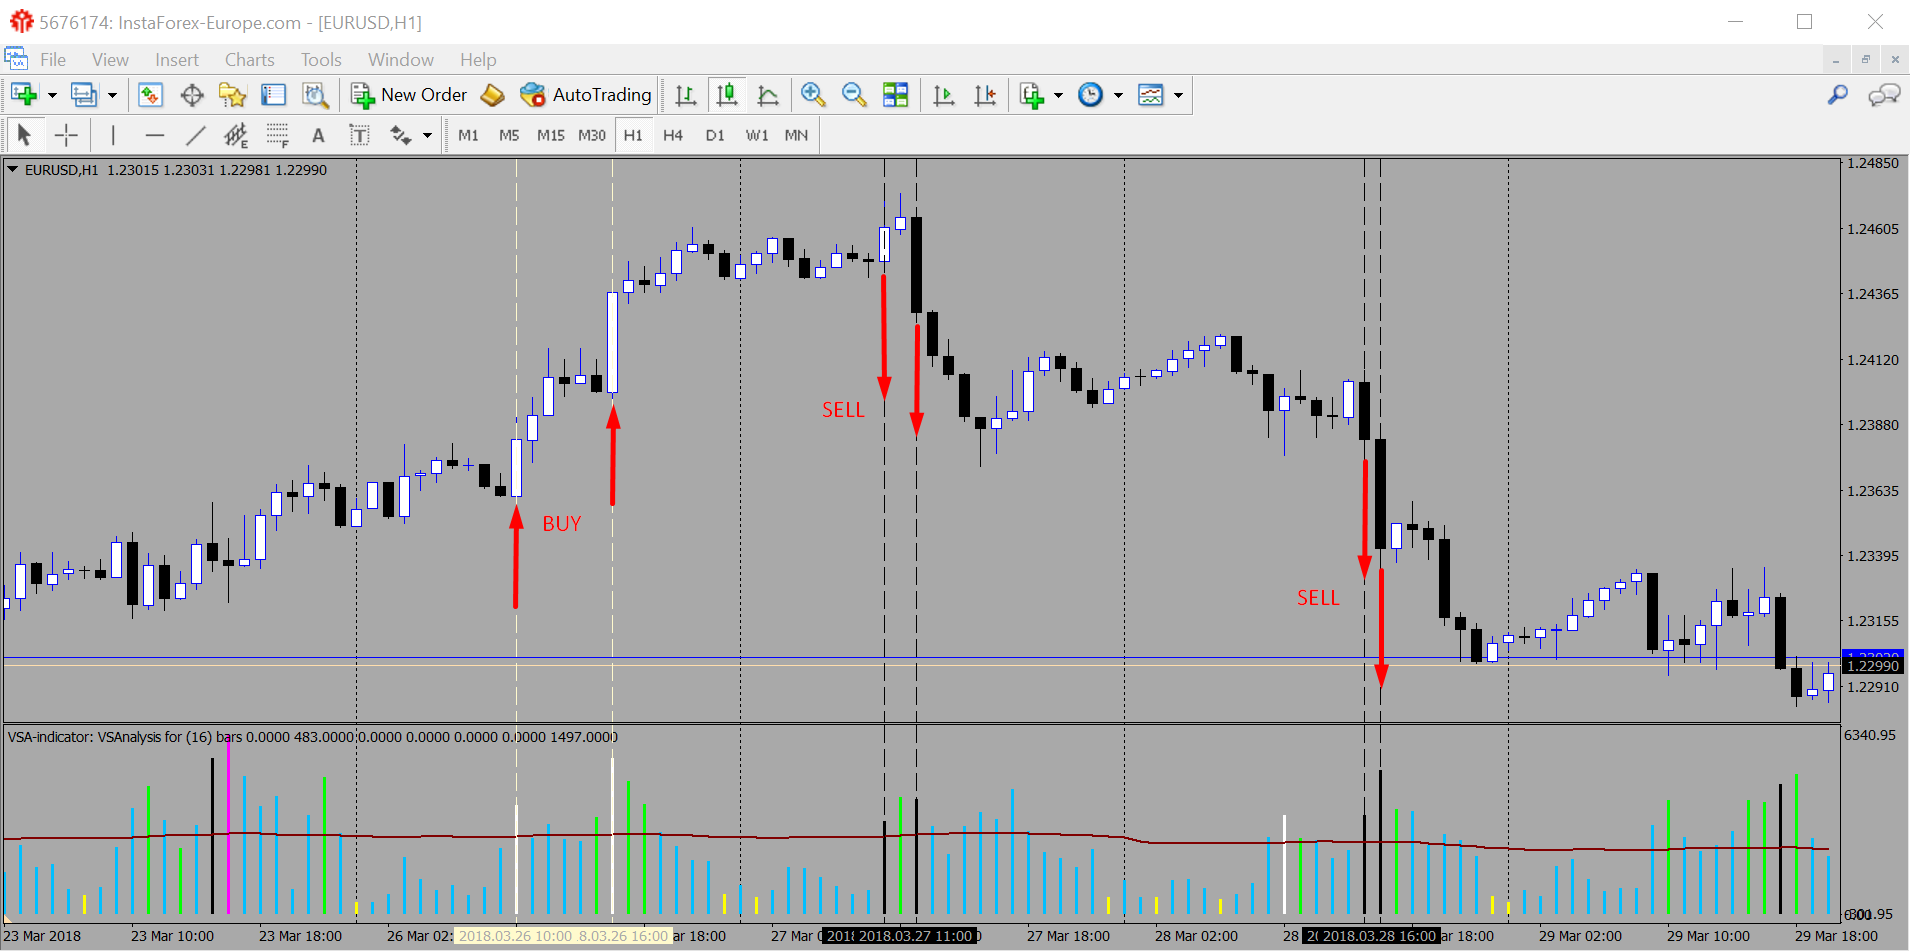
By holding the mouse pointer over a VSA histogram bar, you can see the VSAnalysis comment for current Market quotes. VSA histogram bar shall mean the element of the VSA indicator which shows Volume Spread and color that explains the particular market situation.
Moving Average MA(100) (100, by default) All of the VSA histogram bars which are over the MA(100) that is the signal to active trading.
The color of VSA histogram bar is White. Volume Climax Up: High volume, high range, up bars. That is the signal to BUY!
The color of VSA histogram bar is Black. Volume Climax Down: High volume, high range, down bars. That is the signal to SELL!
The color of VSA histogram bar is Blue. Neutral Volume: When there are no volumes. That is the signal to Wait!
The color of VSA histogram bar is Green. High Volume Churn: High volume, low range bars. That is the signal to Close your trades!
The color of VSA histogram bar is Magenta. Both the above conditions (High Volume Churn and Volume Climax Up or Down or Volume Climax Down). That is the signal to Wait!
The color of VSA histogram bar is Yellow. Low Volume: Low volume bars. That is the signal to Wait!
Volume Analysis Indicator test
Volume Spread Analysis Indicator analyzes the market situation and gives a forecast for the current moment, but your trading will be much more profitable if you have the ability to volumetric analysis and strategy analysis in the broad sense of the word. This means that you need to connect the VSA indicator data with other indices, which include the analysis of macroeconomic, political, currency, stock and commodity trends, as well as correctly assess seasonal fluctuations in various sectors of industrial production, real estate, services, unemployment level, interest rates of Central Banks and much more.
Our experience in creating indicators for market analysis shows that it is necessary to regularly develop your ability to volume analysis. No indicator can replace this ability. VSA indicator is your assistant, but the final decision: to buy, sell or stay out of the market is only your decision.
We offer you this test that can be an excellent simulator for developing your skills for volume analysis.
We recommend starting with the Entry-level test, and only then proceed to the Mid-level test and High-level test!
The guide to installation of free VSA indicator and template
VSA indicator is available in the VSA-indicator-en.zip
1. Download and Extract all VSA files from the VSA-indicator-en.zip (In English)
2. Start the trading terminal MetaTrader МТ4/МТ5;
3. If you started the MetaTrader, select [File] [Open Data Folder];
4. Copy two folders from the VSA-indicator-en.zip to [MQL4] and [templates];
5. Restart the MetaTrader;
6. Select the template [VSA-indicator-en] from the MetaTrader templates list;
7. [VSA-indicator-en] template is pre-installed template for any MetaTrader chart wish VSA indicator using particular VSA color scheme, like at following figure.